Integrated Performance Report - February 2025
Meeting: Trust Board – Public Meeting
Date: 12 February 2025
Report Title: Integrated Performance Report
Agenda Item: PUB25/02/2.1
Author: Laura Hughes – Head of Information and Analytics
Lead Director: Dr Hein Scheffer – Director of Strategy and Transformation
Purpose: Discussion/review
Assurance: Reasonable
Link to CQC domain:
- Caring
- Responsive
- Effective
- Well Led
- Safe
Link to Strategic Objective:
- Be an exceptional place to work, volunteer and learn
- Provide outstanding quality of care and performance
- Be excellent collaborators and innovators as system partners
- Be an environmentally and financially sustainable organisation
Link to Strategic Risk:
- SR1a: If we do not ensure our people are safe and their wellbeing prioritised, there is a risk that we will be unable to attract, retain and keep all our people safe and well
- SR1b: If we do not ensure our leaders are developed and equipped, there is a risk that we will not be able to change our culture, and value, support, develop and grow our people
- SR2: Failure to achieve continuous quality improvements and high-quality care delivery
- SR4: Failure to deliver an efficient, effective and economic service
- SR5: If we do not clearly define our strategic plans, we will not have the agility to deliver the suite of improvements needed
- SR6: Ability to ensure sufficient capacity and capability to ensure sustainable change
Equality Impact Assessment: No negative impact identified
Previously considered by: Executive Leadership Team
Recommendation: The Board is asked to note the areas of improvement and decline and consider the critical issue areas highlighted to gain assurance on the plans for mitigation.
Purpose: To enable the Board to discuss the performance areas identified and the actions offered to gain assurance of delivery.
Introduction / Background:
The Integrated Performance Report (IPR) consists of core metrics to monitor the performance across all main functions of the organisation in the pursuit of achievement of our strategic goals.
Each of the relevant Executive Directors provide a short overview of the key critical areas outlined.
Our performance improvement for 2024-25 is supported by the Trust’s Integrated Performance Report (Appendix 1) with some modifications to support better scrutiny and oversight now implemented. This includes:
- A colour-coded assurance matrix at the beginning of each section to enable the easy identification of key areas that should be focussed on, and areas where performance is positive.
- Metrics that are no longer appropriate have been removed and replaced by new, more appropriate metrics.
- Additional metrics that support better oversight and scrutiny.
- Process limits are refreshed annually. This may see sustained linear performance come out of special cause improvement as the limits of performance have narrowed alongside the indicator being above or not hitting target.
Executive Summary:
The Integrated Performance Report (IPR) comprises December 2024 data across the key areas of the Trust.
Looking forward into 2024-25 and focusing on the Trust’s four goals, the key high-level areas of positive performance and areas the Trust is or should focus on are below. This should be considered in conjunction with the more detailed Executive Summary and IPR in the attached Appendix 1. as follows:
| Goal | Areas of positive performance | Areas of focus |
|---|---|---|
| Goal 1 - Be an Exceptional Place to Work, Volunteer and Learn | People Services metrics continue to show a sustainable and improved position in most areas. Staff vacancy rates continue to reduce with a further significant positive shift to 4.6%, which is under the annual target of 10%. Staff turnover continues to be consistently better than target at 8.12% with a Trust target of 10%. Resus Adults compliance is above target at 87% and is showing special cause improvement. | Sickness absence rates performance is in special cause concern in December 2024 at 10.23% against a target of 8.6%. Mandatory training decreased to 82% against a target of 85% and remains in special cause concern for six consecutive months. Declared disability and BME staff % remain in special cause improvement. Appraisal compliance remains at 89% for the third consecutive month. |
| Goal 2 - Providing Outstanding Care and Performance to Our Patients | Complaints per 10,000 patient interactions continues to reduce. Level 1 Safeguarding training compliance is above target for both adults and children. | Compliance with response to complaints has decreased from 57% to 50%. Trust premises audits remain below the 95% target at 83% and is in special cause concern. Vehicle audits and uniform compliance remain just below target. Level 2 Safeguarding (adult and children) are in special cause concern. |
| Goal 3 - Be Excellent Collaborators and Innovators as System Partners | Acceptance rate achieved a 65% regional average. | Community First Responder volunteer daily hours are below target. |
| Goal 4 - Be an Environmentally and Financially Sustainable Organisation | The year-to-date (YTD) position is surplus to plan of £1.4m | QCIP shortfall of £0.7m YTD against target. Operations Support expenditure shows a YTD deficit to budget of £4.4m. Patient Transport Service YTD expenditure deficit to budget is £1m. |
The 2025/26 IPR redesign project is underway to further refine and develop the Board and Committee IPRs. The aim of this project is to ensure reported KPIs are aligned to the relevant governance committee and support the Trust’s goals and strategy. The new 2025/26 Board IPR will be launched in May 2025 and Committee IPRs will follow as meeting dates fall.
The Organisational Performance Improvement Plan (OPIP) key assumption metrics for December 2024 are provided (Appendix 2). In November 2024, in year trajectories were redeveloped and include new metrics in operational areas such as ‘shrinkage’ for EOC to align. Reporting will reflect new trajectories in January 2025 once sign-off and agreement has taken place.
Across the 10 key assumptions, some points to note are that the Clinical Workforce Plan target figures for December have exceeded the year-end target and delivered. Job cycle time for December overall remained under target, however for conveyed incidents this is 5-minutes above the target of 1 hour 7 minutes at 1 hour 12 minutes. Staff turnover remained under the 10% target at 6.22%. Overtime hours exceeded the weekly target for December on average over 5,583 hours a week (the target is 4,300). Time lost to hospital handover delays was at its highest in December with a weekly average of 5,518 hours lost over 15-minutes (the target is 2,000 hours).
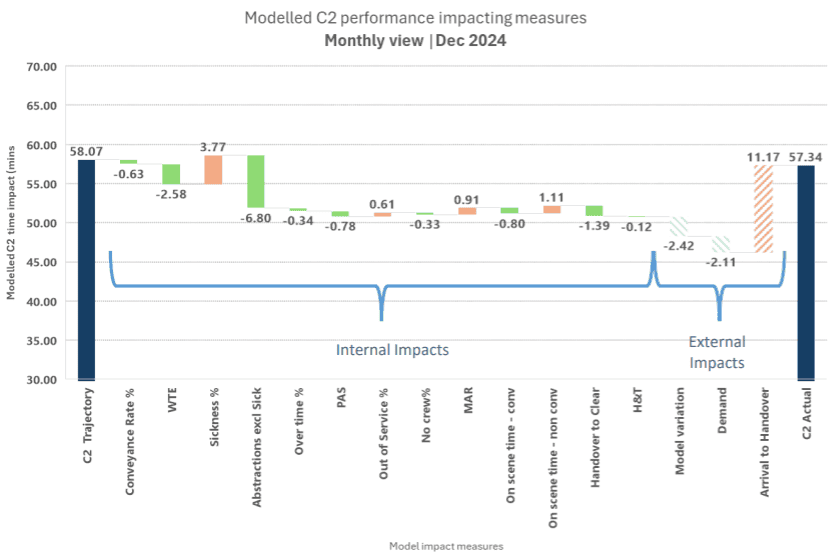
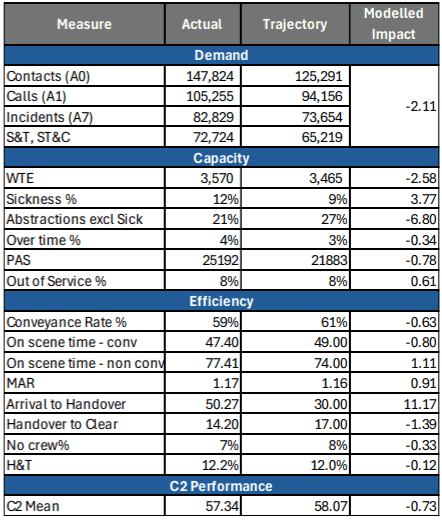
EEAST modelling for December can be found in Appendix 3 and is provided in a waterfall chart output. The modelling is based on previous modelling that was undertaken in collaboration with PA Consultancy reviewing C2 performance. The modelling is used to support connected planning within the Trust and reviews a variety of performance metrics and their contribution and impact to overall C2 performance.
The view for December provides the C2 trajectory based on the model’s previous two years of data and then provides how each measure in minutes is impacting the model. Internal impact measures which included staff sickness, out of service %, MAR, on scene time non-conveyed, contributed to a negative impact on performance in December 2024. External impact measures including arrival to handover at hospital also had a negative impact on C2 performance.
Appendix 1: Trust Integrated Performance Report
Appendix 2 – OPIP Key Assumptions

Appendix 3 – EEAST Modelling view for December 2024